Follow the instructions below to view Task information via the CDP Interface.
| Tip You can access the summary of the last 10 finished replications and the last 10 Tasks with alerts from the Dashboard. See Using Standard Edition Dashboard, Using Enterprise Edition Dashboard, Using Advanced Edition Dashboard. |
| Tip The Task results can be sent via email as a Report. See Reporting. |
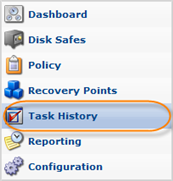
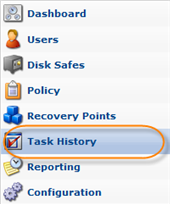
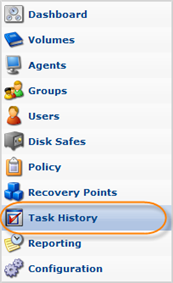
1. Click on "Task History" in the Main Menu to open the "Task History" screen.
| Standard Edition | Advanced Edition | Enterprise Edition |
|---|---|---|
 |
 |
 |
2. In the "Task History" list, find the Task you want to view the summary for and click it.
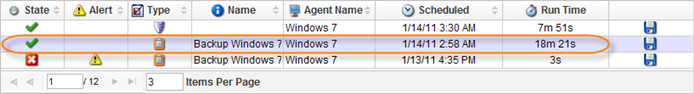
| Tip To find a Task, you can use the Basic and Advanced List Filters. See Customizing the Task History List. |
3. Select the necessary tab in the Details pane in the right bottom part of the screen. The available list of tabs depend on the type of the selected task. The following tabs are common for all task types:
- Summary - Accumulates general information about the task including verbose status and statistics. If the task is running, displays the progress bar and performance.
- Alerts - Contains Alerts that occurred during Task run. See Viewing Alerts.
- Logs - Shows logs messages received from the CDP Server and Agent. See Viewing Log Messages.
- Task - Shows details about the selected Task.
Summary Tab of a Finished Task
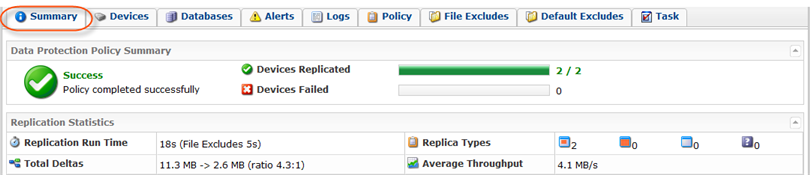
The following example provides the list of fields displayed on the "Summary" tab of a finished Data Protection Policy task.
"Data Protection Policy Summary" Block
The first block indicates whether replication policy is completed successfully or with alerts; shows the number of replicated and failed devices.
"Statistics" Block
- Replication Run Time - Indicates total amount of replication performance time in hours, minutes, and seconds. Time spent for File Excludes is shown in brackets.
- Total Deltas - Shows the ratio of received and not received Deltas.
- Replica Types - Details on replica types: CDP replication, Block Scan, Initial Replica, Unknown Replica Type.
- Average Throughput - Average throughput of the task in MB/s.
Summary Tab of a Running Task
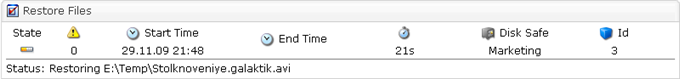
The following example provides the list of fields displayed on the "Summary" tab of a running Restore Files task.
"Restore Files" Block
- State - Graphically indicates the current State of the Task. The state can change over time. Move the mouse pointer over it to display a yellow tool tip that informs you of what the icon indicates. A Task can be in one (1) of the following states:
- Queued - The Task is waiting and will run as soon as more resources are available.

Note
If Agent is busy, the Tasks are queued, not rejected. - Running - The Task is currently in progress.
- Finished - The Task has completed successfully and without errors.
- Error - The Task has completed with one or more errors.
- Canceled - The Task has been terminated while running by the User on the "Task History" page.
- Duplicate - There is a duplicate scheduled Task in the queue.
- Queued - The Task is waiting and will run as soon as more resources are available.
- Alerts - Indicates how many alerts have been received for the Task. The alerts are available on the "Alerts" tab.
- Start Time - Date and time when the Task was started.
- End Time - Date and time when the Task was finished or terminated. For running Tasks, the field is empty.
- Run Time - Total time the Task has been in progress. For running Task, the value is changing.
- Disk Safe - Description of the Disk Safe from which the data is restored.
- Recovery Point ID - Identifier of the Recovery Point (within the Disk Safe) from which the data is restored.
- Status - For running Tasks, provides information about current action. For example:
- Excluding Files
- Replicating E:\ using full block scan (CDP is out of sync)
| Note "Task Finished" status is shown for Tasks not running. |
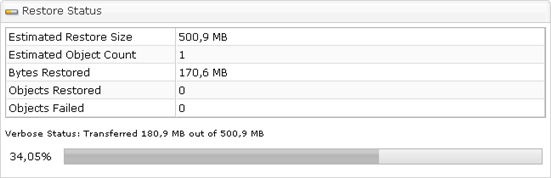
"Restore Status" Block
- Estimated Restore Size - Preliminary size of data being restored. Available if the checkbox "Estimated Restore Size" is selected during Data Restore.
- Estimated Object Count - Preliminary count of objects being restored. Available if the checkbox "Estimated Restore Size" is selected during Data Restore.
- Bytes Restored - How many bytes have been restored.
- Objects Restored - How many files/folders have been restored.
- Objects Failed - How many files/folders have failed to be restored. Highlighted by red color.
- Verbose Status - Detailed information about event currently happening. For example, "Transferred 180,9 MB out of 500,9 MB." The value changes over time. Available only for running Tasks.
- Progress bar - Displays percentage of already replicated resources. The value grows over time. Available only for running Tasks.
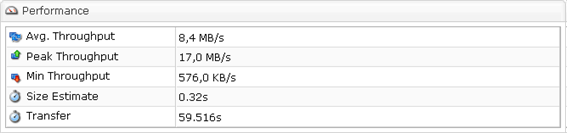
"Performance" Block
The data is changing "on the fly" during task completion.
- Current Throughput - Rate of successful message delivery over a communication channel at a present point of time (megabytes, kilobytes, or bytes per second; blocks per second). This field is only available for running Tasks.
- Avg. Throughput - Rate of successful message delivery over a communication channel averaged over the Run Time (megabytes, kilobytes, or bytes per second; blocks per second).
- Peak Throughput - Maximum throughput achieved during the Run Time (megabytes, kilobytes, or bytes per second; blocks per second).
- Min Throughput - Minimum throughput measured during the Run Time (megabytes, kilobytes, or bytes per second; blocks per second).
- Size Estimate - Measurement in seconds. Available if the checkbox "Estimated Restore Size" is selected during Data Restore.
- Transfer - Total time the Task has been in progress. For running Task, the value is changing. Available if the checkbox "Estimated Restore Size" is selected during Data Restore.
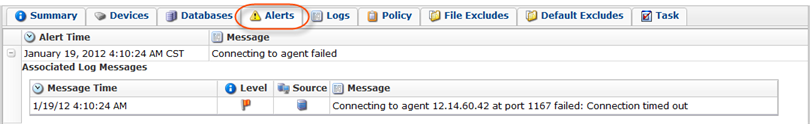
Alerts Tab
The following example provides the list of fields displayed on the "Alerts" tab of a task.
- Alert Time - The exact date and time (in hours, minutes, and seconds) of the alerts that occured during the task performance.
- Message - The text of a Log Message.
- Message Time - The exact date and time (in hours, minutes, and seconds) that the alert message was received.
- Level - Graphically indicates the level of the log message:
- Info - Presents a general notification about a recent event.
- Warning - Alerts of a perilous, detrimental event. For example, reaching soft quota.
- Error - Informs the user that an operation could not continue or complete due to some insurmountable error.
- Source - Graphically indicates where the message has come from: CDP Server or Agent.
- Message - Contains the text of Log Message.
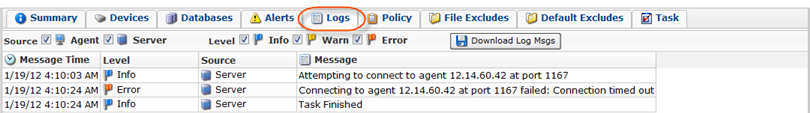
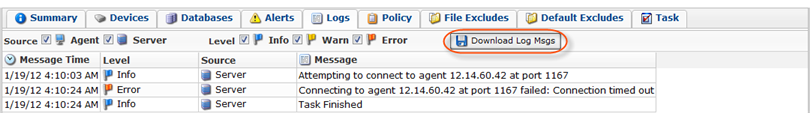
Logs Tab
The following example provides the list of fields displayed on the "Logs" tab of a task.
- Message Time - Displays the date and time the message was received.
- Level - Graphically indicates the level of the log message:
- Info - Presents a general notification about a recent event.
- Warning - Alerts of a perilous, detrimental event. For example, reaching soft quota.
- Error - Informs the user that an operation could not continue or complete due to some insurmountable error.
- Source - Graphically indicates where the message has come from: CDP Server or Agent.
- Message - Contains the text of Log Message.
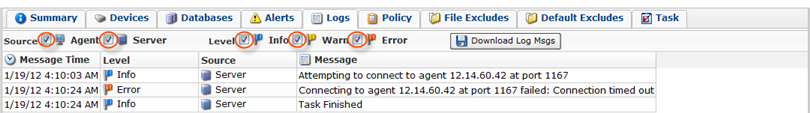
Tips
|
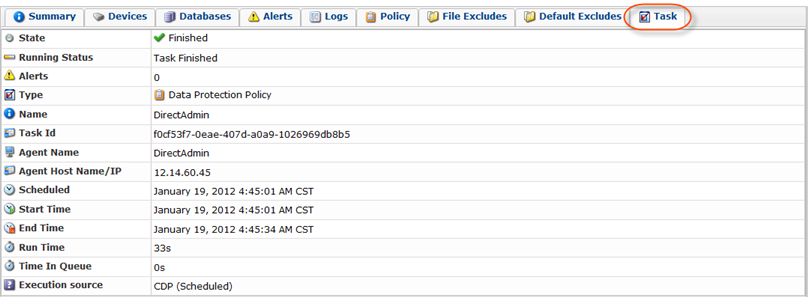
Task Tab
The following example provides the list of fields displayed on the "Task" tab of a task.
- State - Graphically indicates the current State of the Task. The state can change over time if the Task is still running. A Task can be in one (1) of the following states:
- Queued - The Task is waiting and will run as soon as more resources are available.
Note
If Agent is busy, the Tasks are queued, not rejected. - Running - The Task is currently in progress.
- Finished - The Task has completed successfully and without errors.
- Error - The Task has completed with one or more errors.
- Canceled - The Task has been terminated while running by the User on the "Task History" page.
- Duplicate - There is a duplicate scheduled Task in the queue.
- Queued - The Task is waiting and will run as soon as more resources are available.
- Running Status - For running Tasks, provides information about current action.
- Alerts - Indicates how many alerts have been received for the Task.
- Type - Graphically indicates Task type: Restore Files, Merge Recovery Points, Data Protection Policy, Vacuum, Data Base Restore, or Bare Metal Restore.
- Name - For Data Protection Policies, the name specified in the Policy properties is shown in this column.
- Task Id - Identification number generated by the system.
- Agent Name - Shows the name of the Agent.
- Agent Host Name/IP - Shows the IP address of the Agent.
- Scheduled - Date and time when a Task was scheduled.
- Start Time - Date and time when a Task was started.
- End Time - For finished Tasks, the field displays date and time when a Task was finished. For running Tasks, the field is empty.
- Run Time - Duration of a Task. For example, 45m 17s. For running Tasks, the field changes and displays the time that has passed after the Task start.
- Time in Queue - The waiting time while the task is performing.